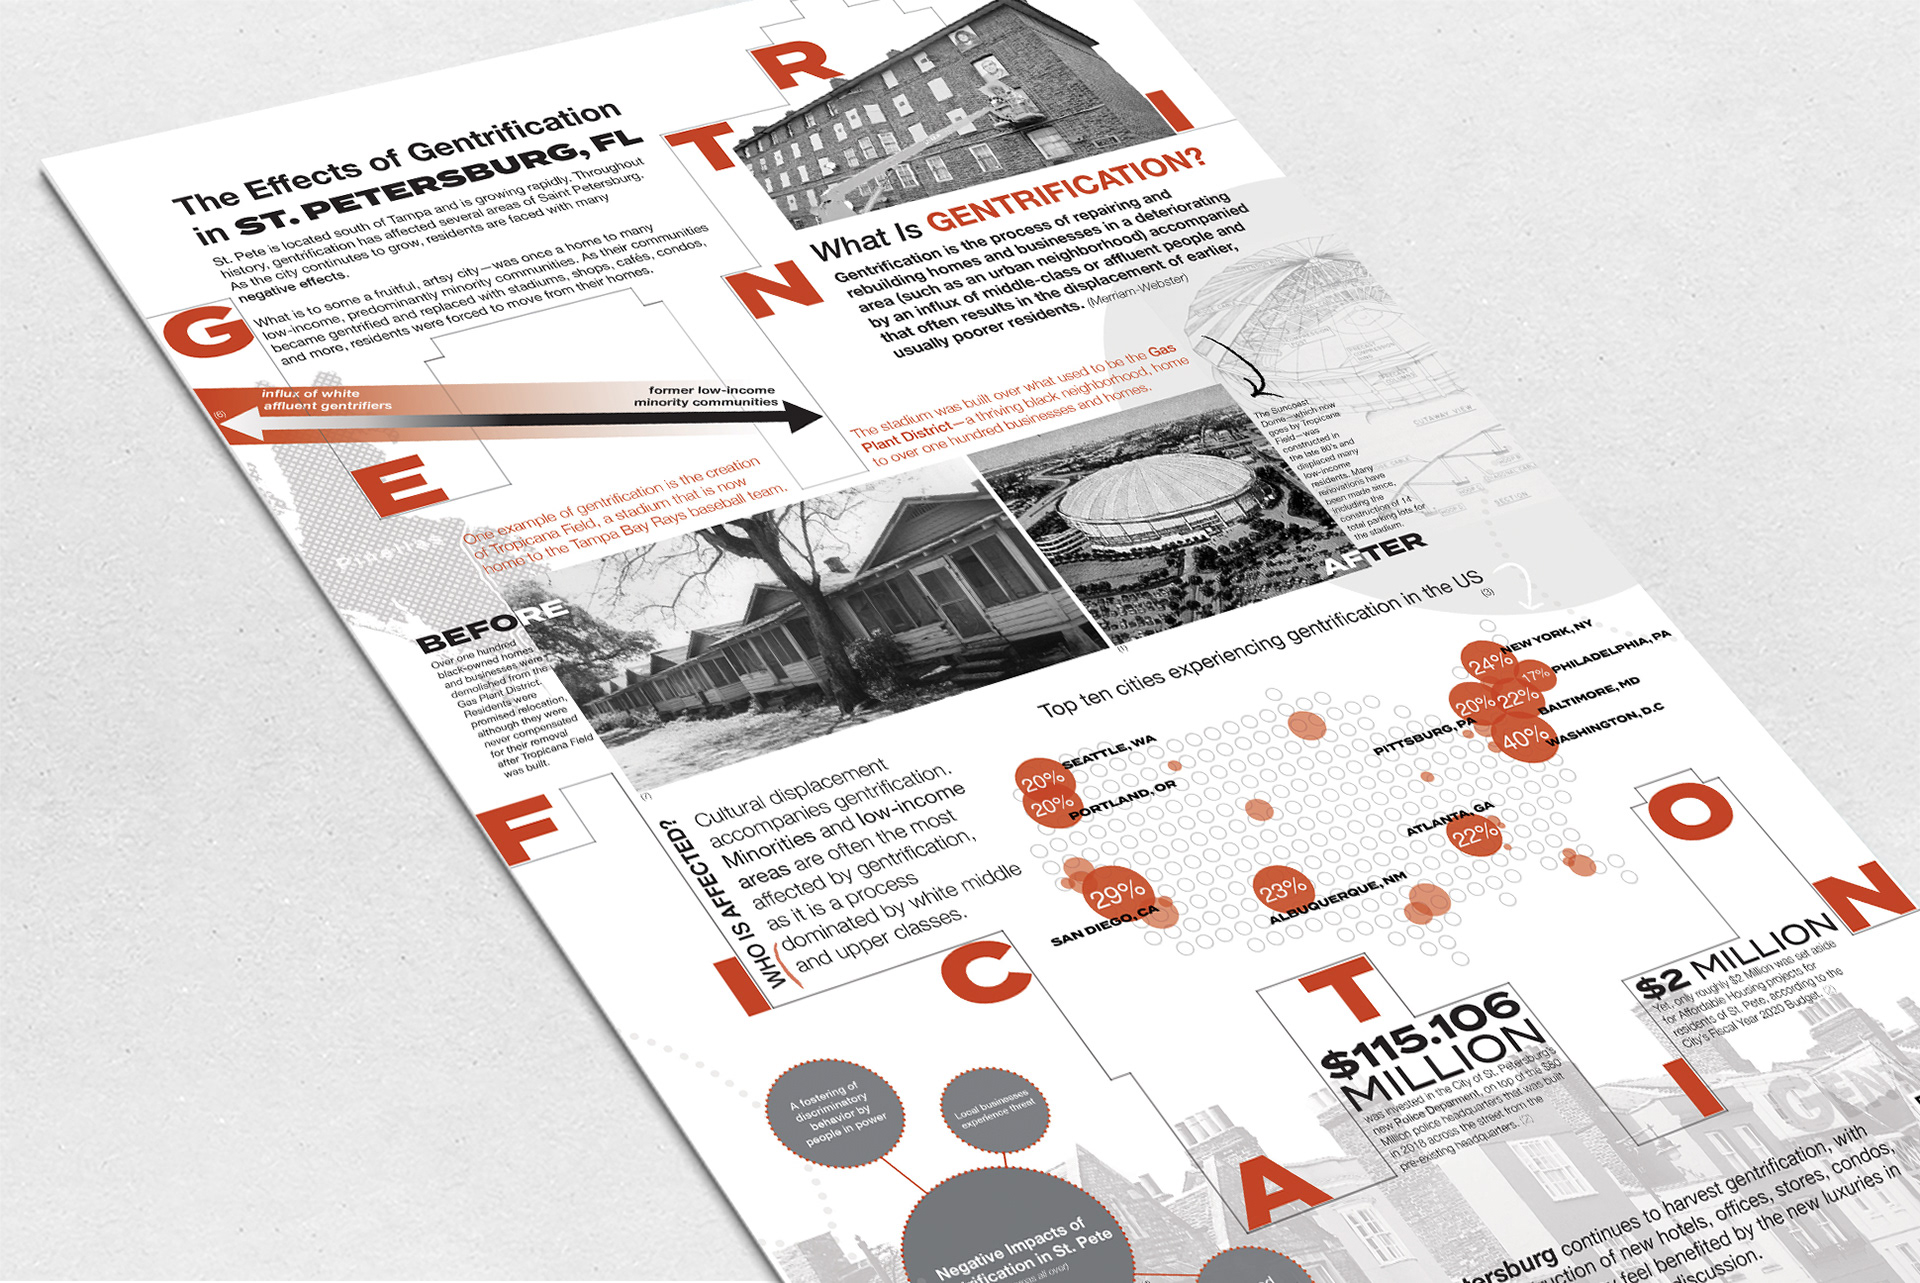
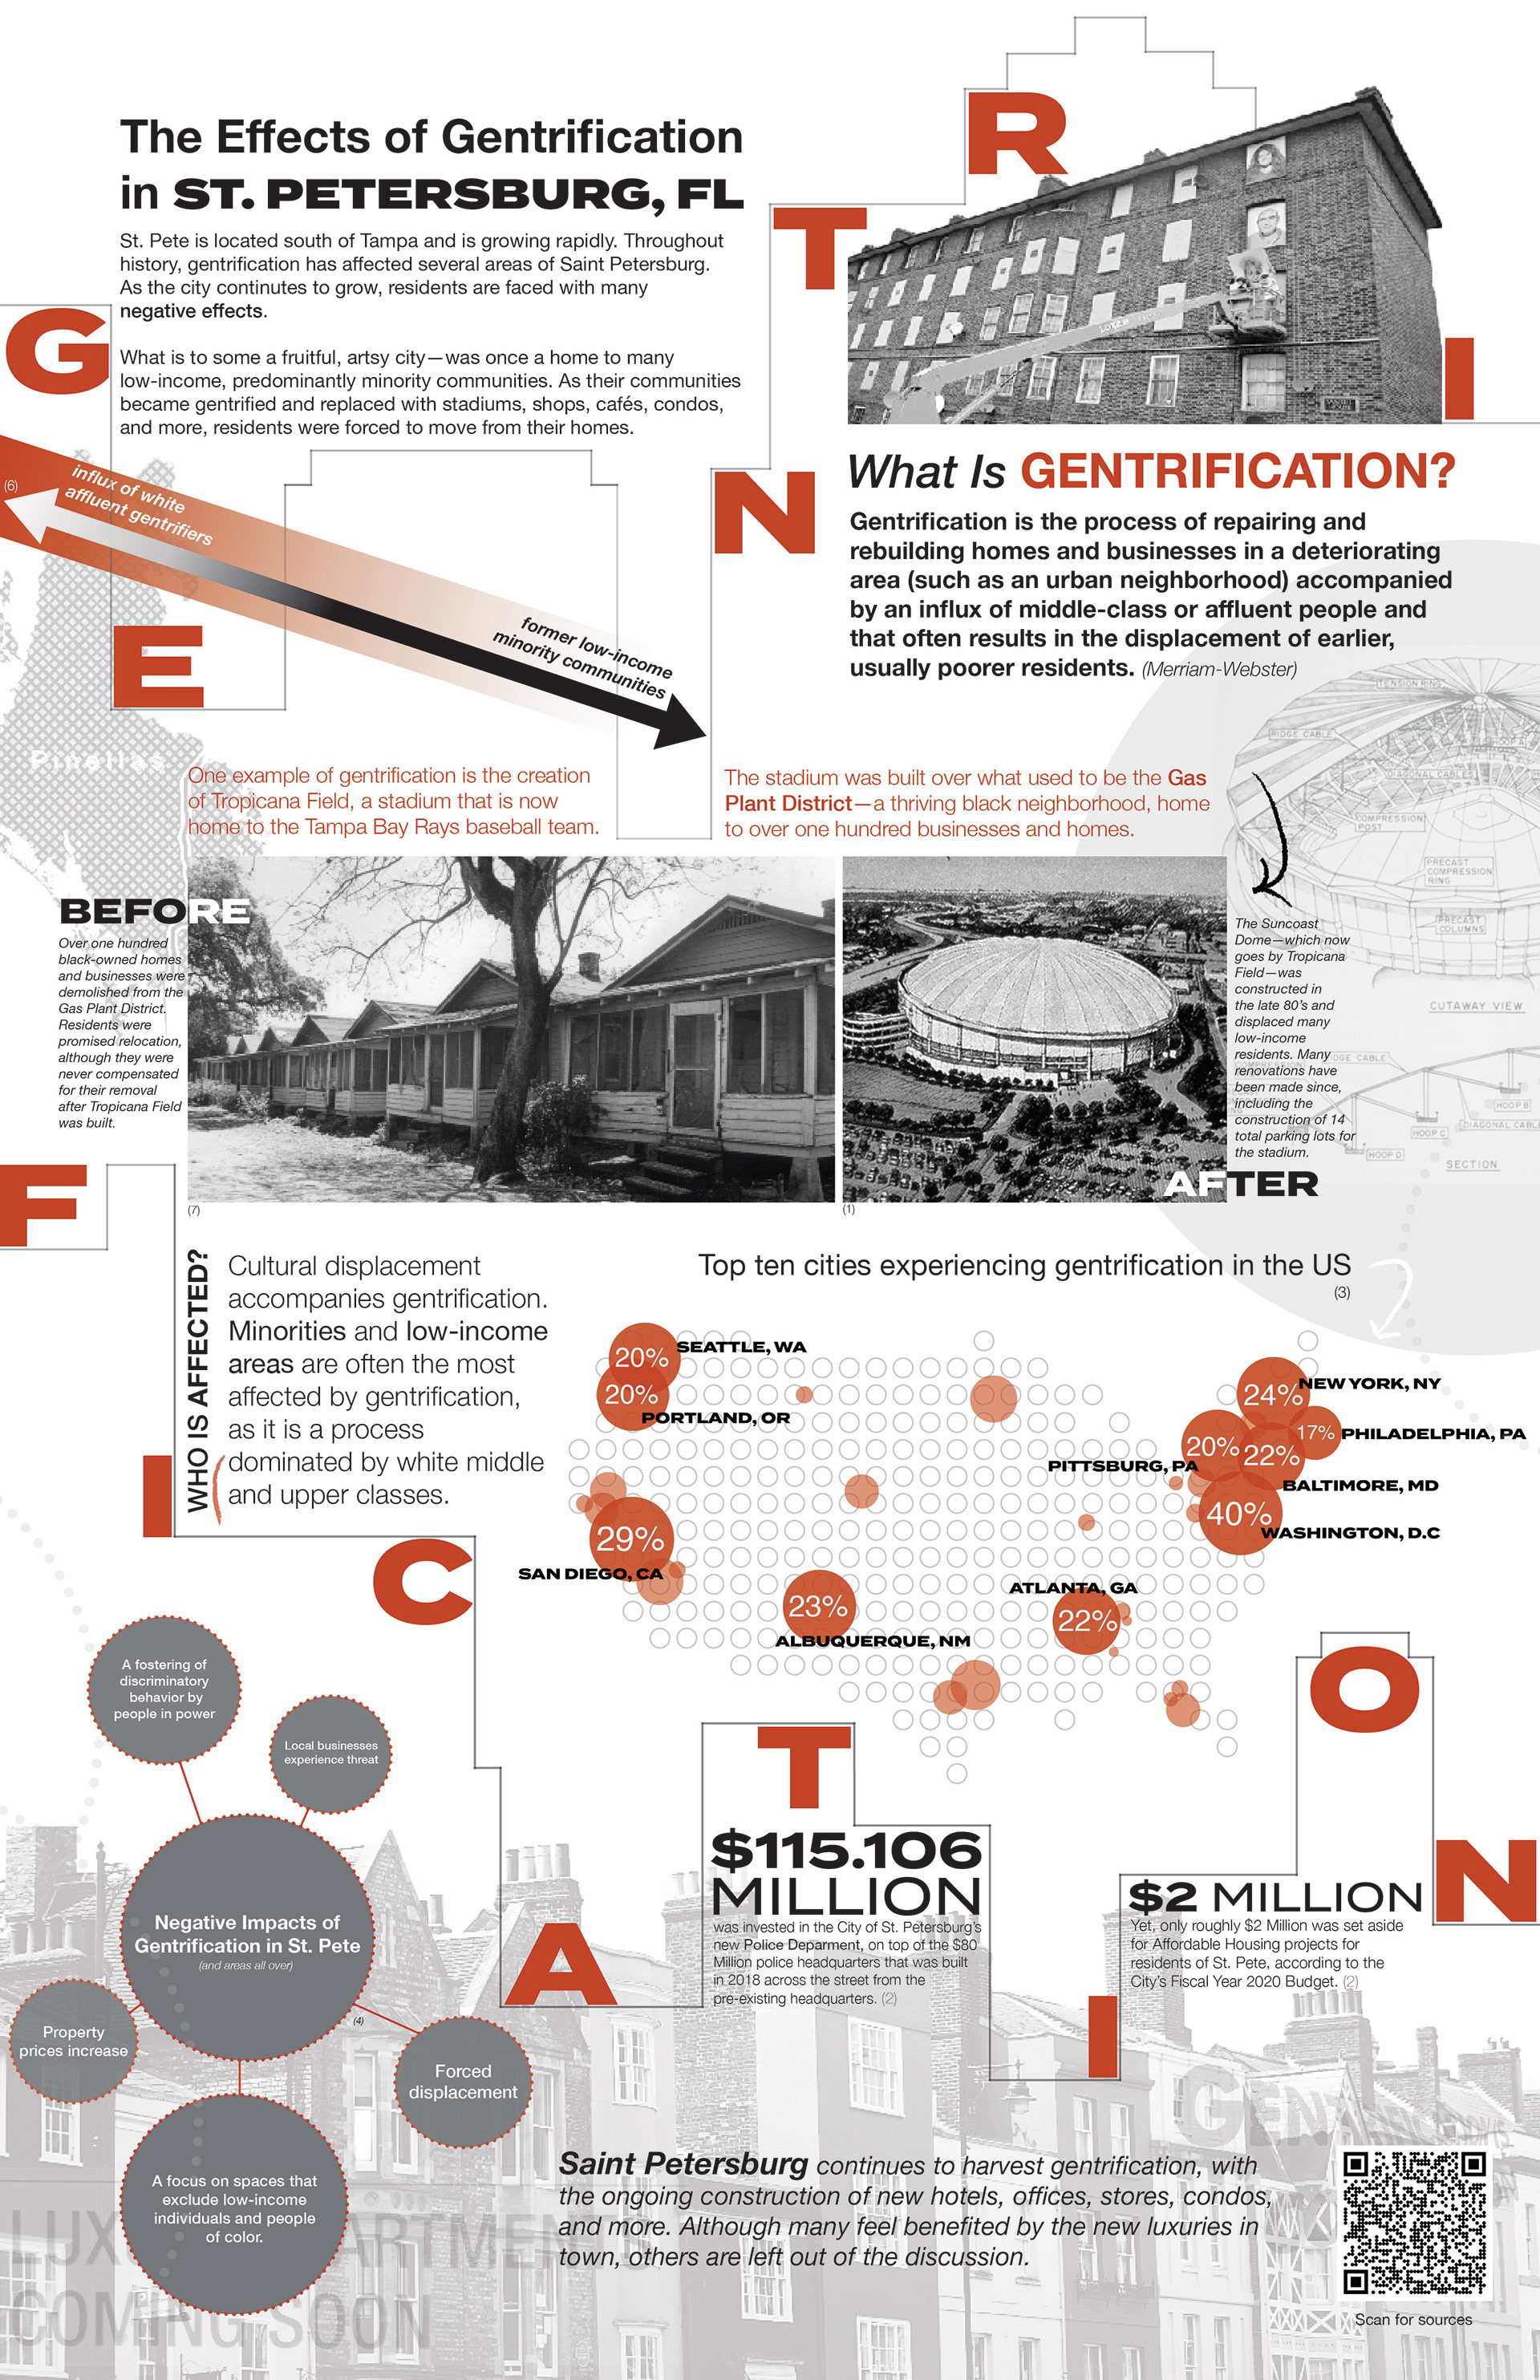
Final Infographic Poster Design
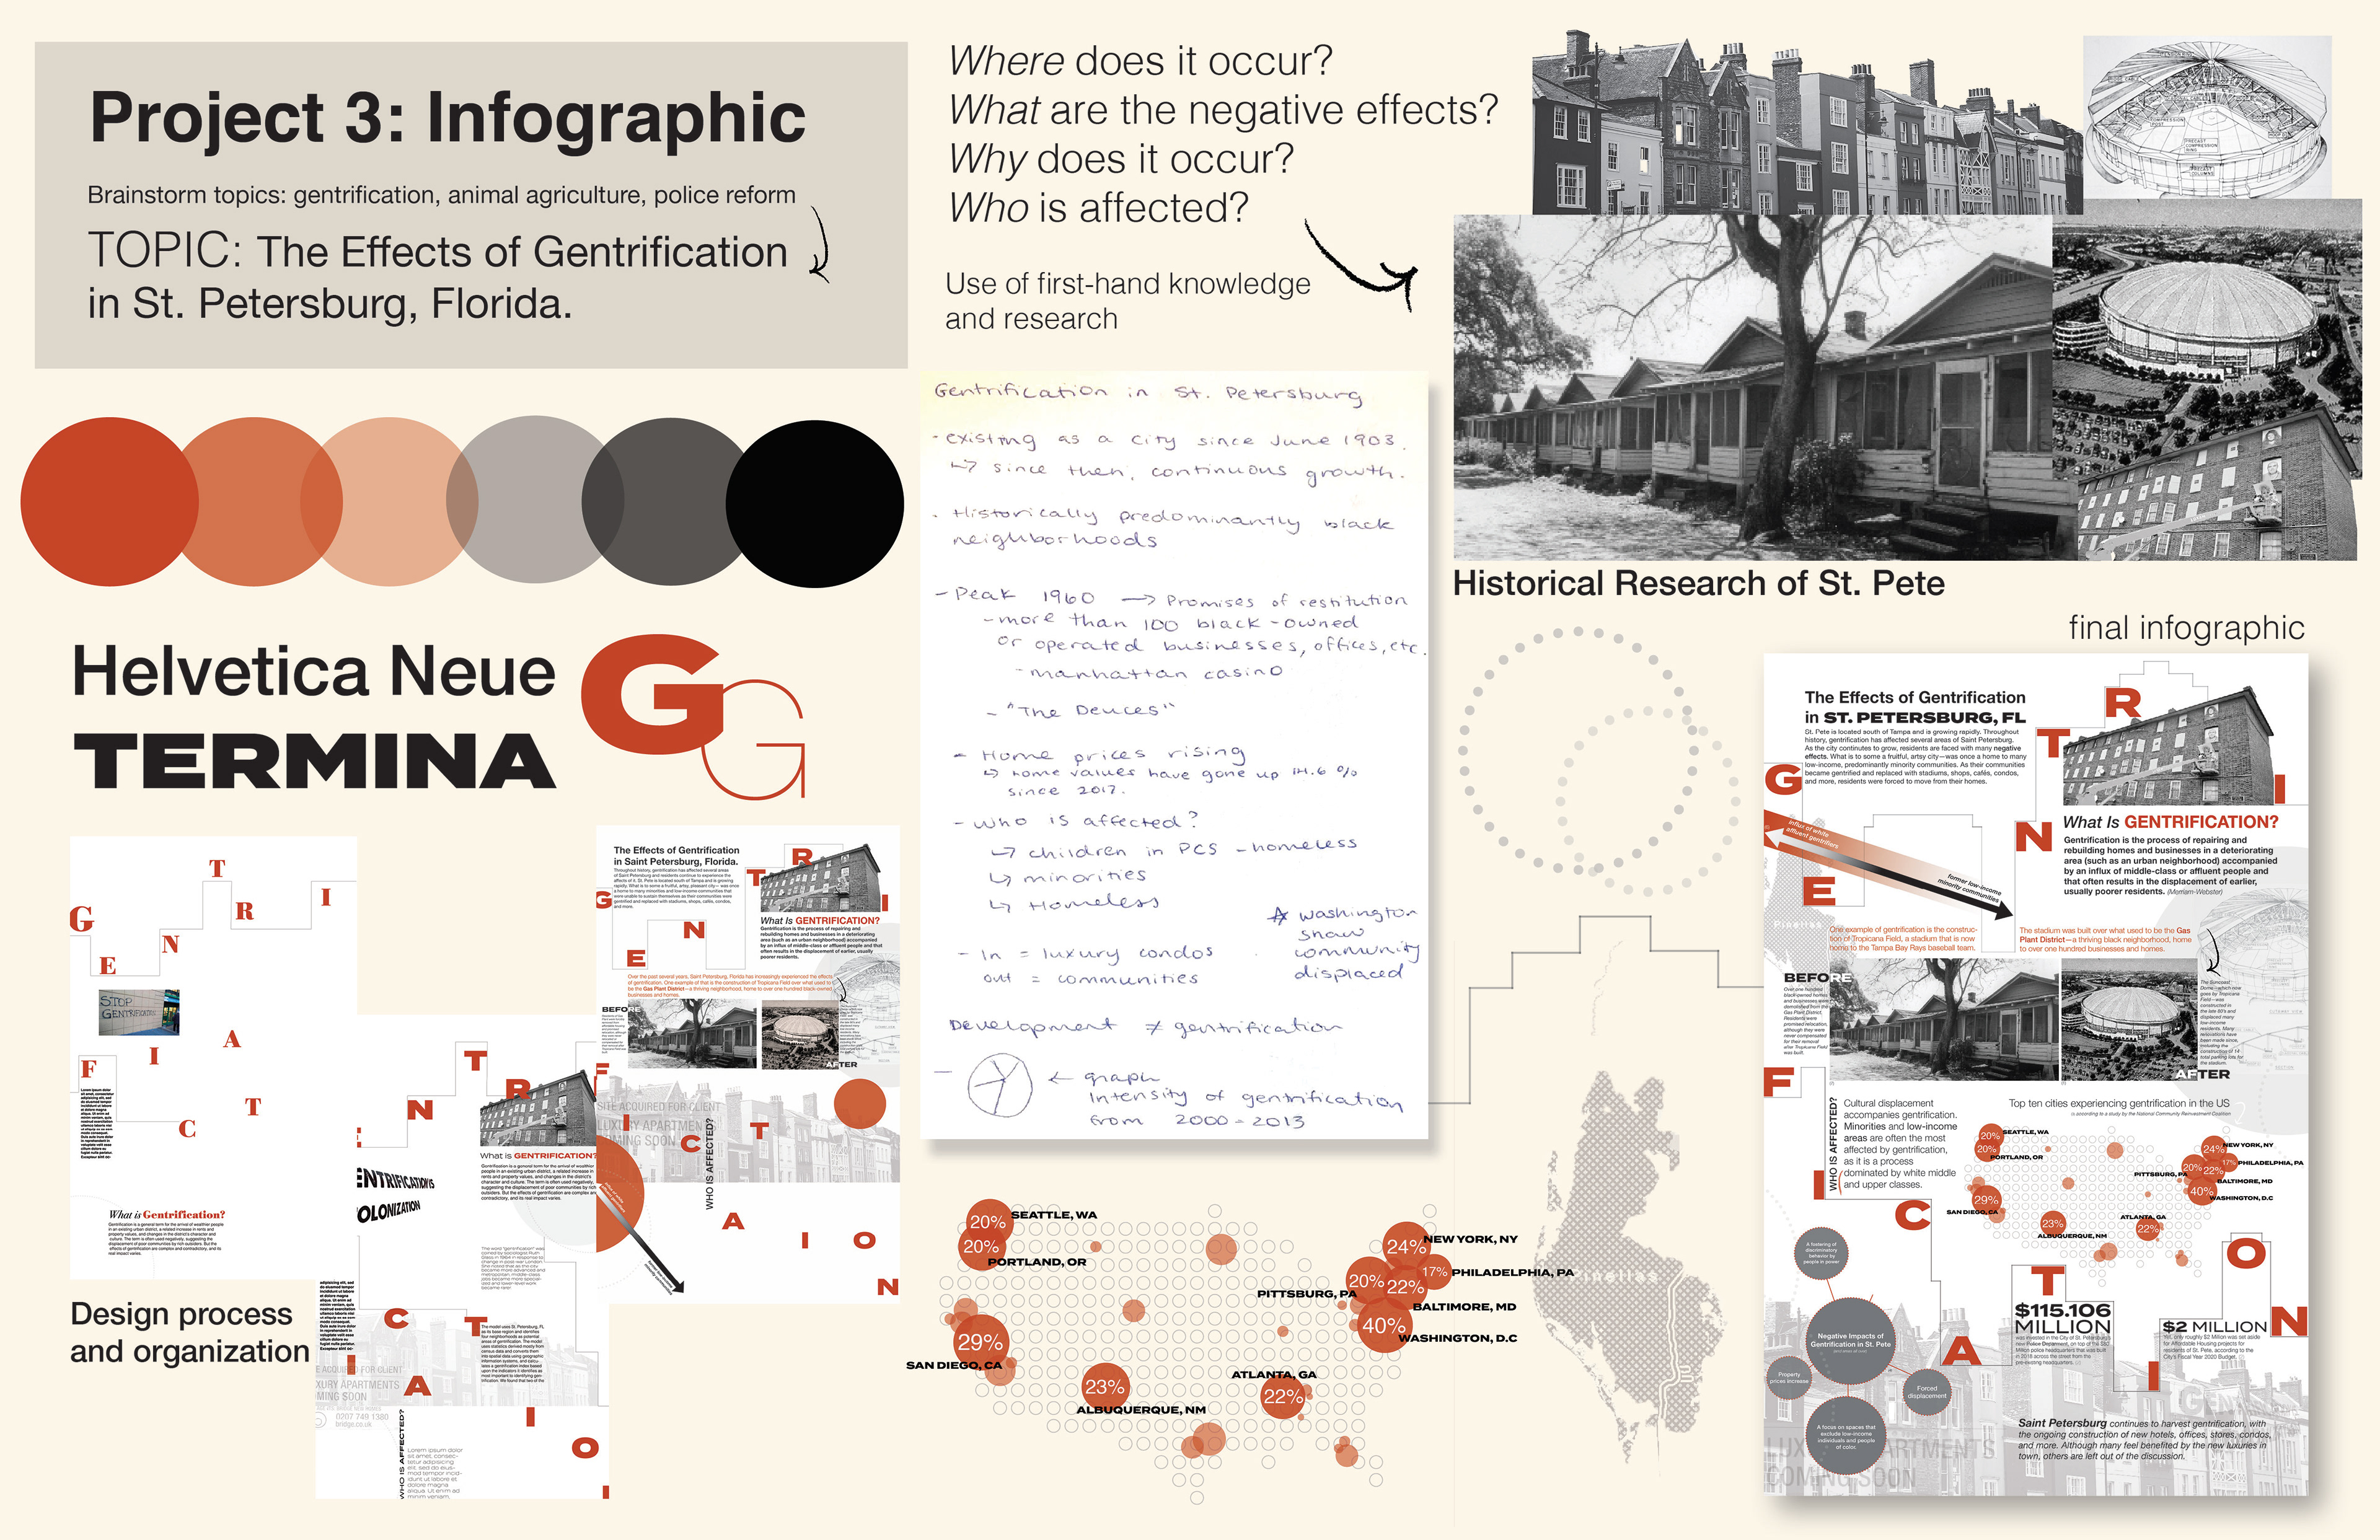
Process
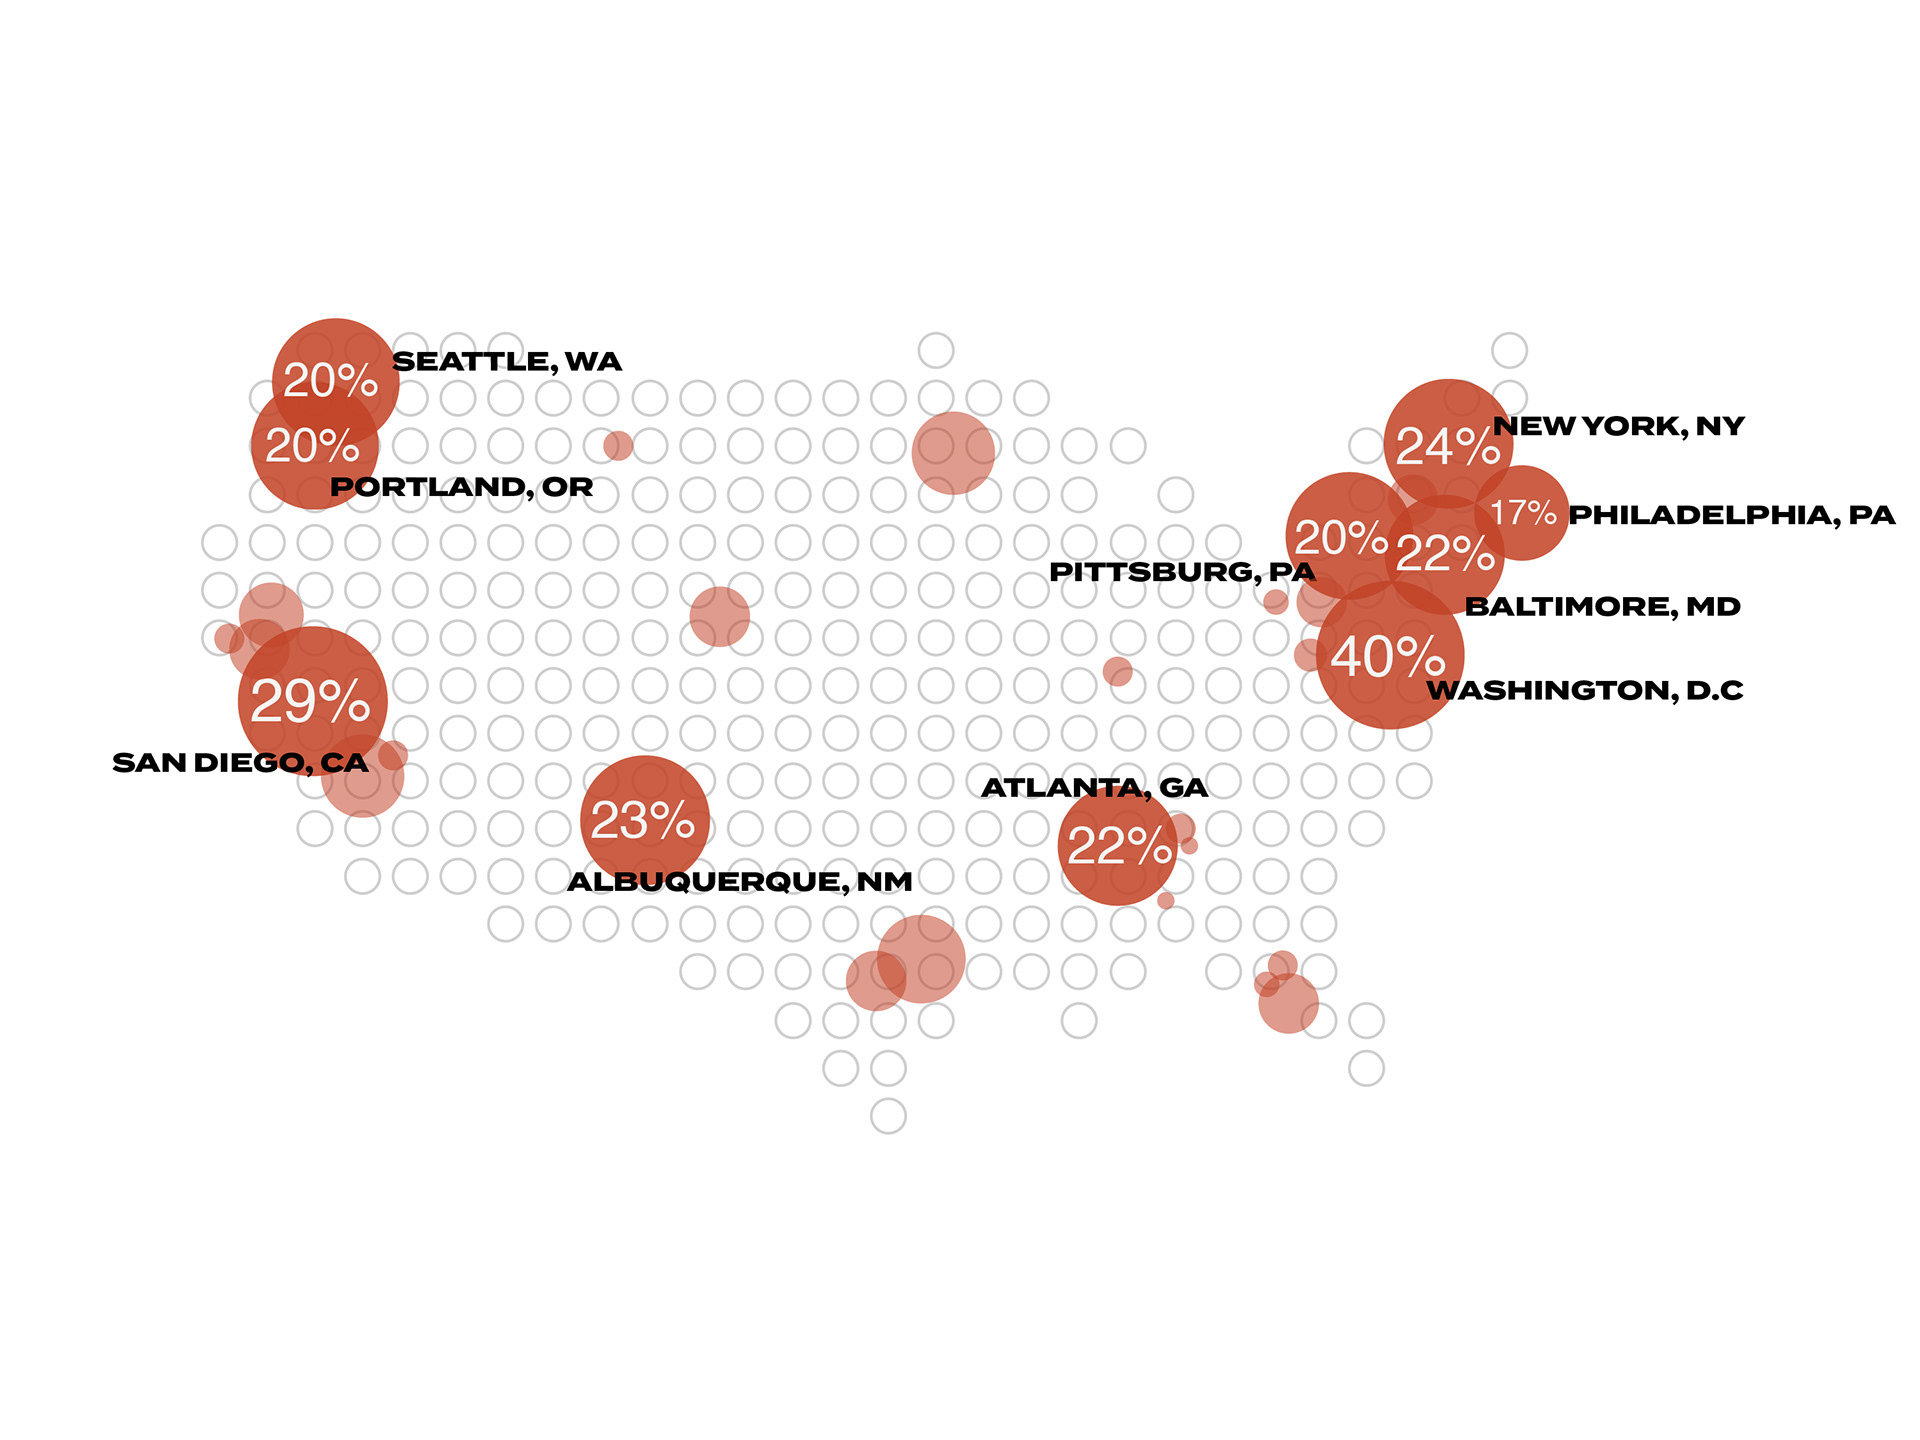
Map Design showing highest Gentrification percentages across the US.


This piece is an infographic created to help viewers' understanding of gentrification. More specifically, I focused on my hometown of St. Petersburg, Florida, and the effects it has there.