

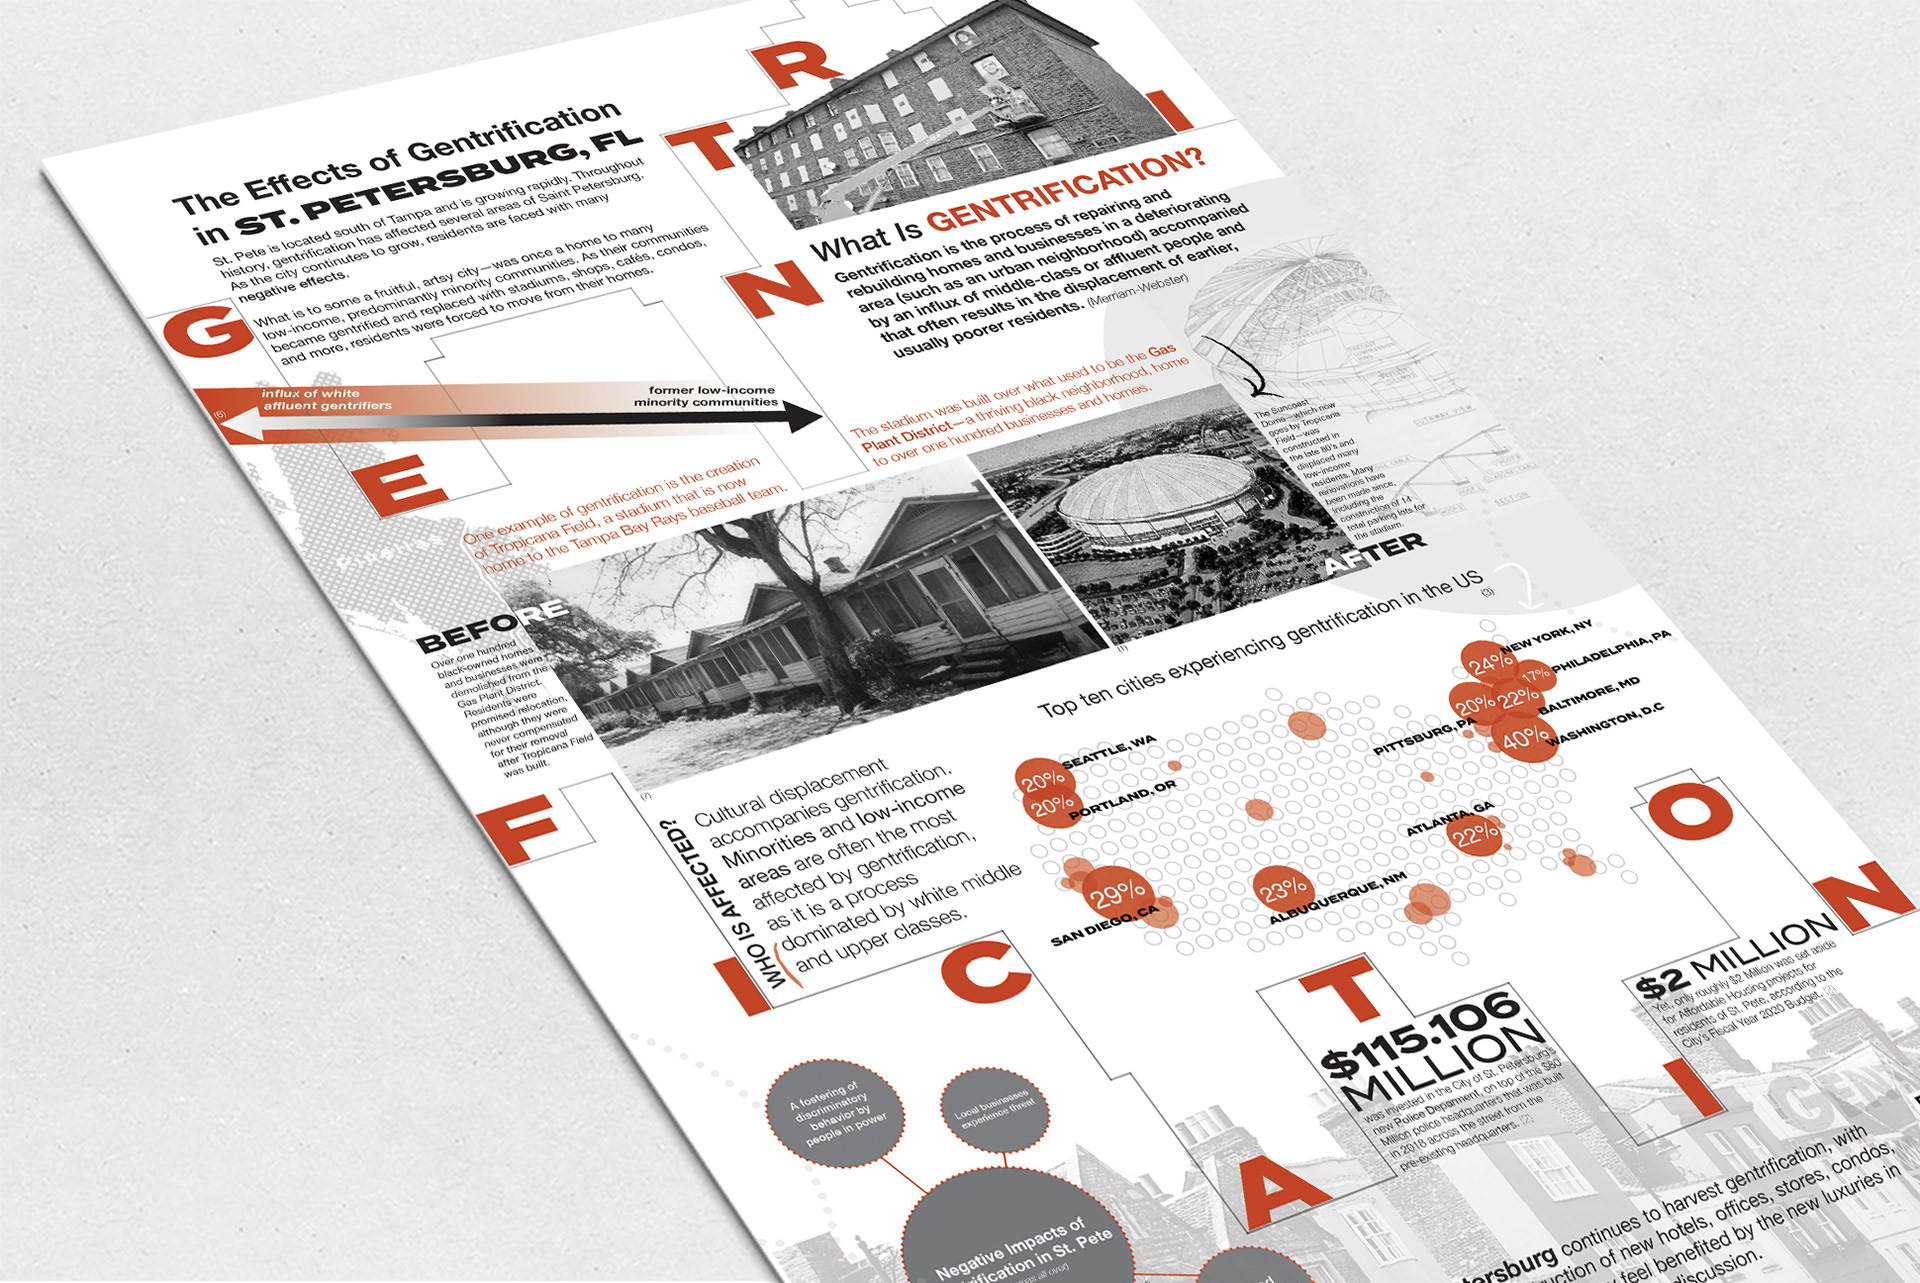
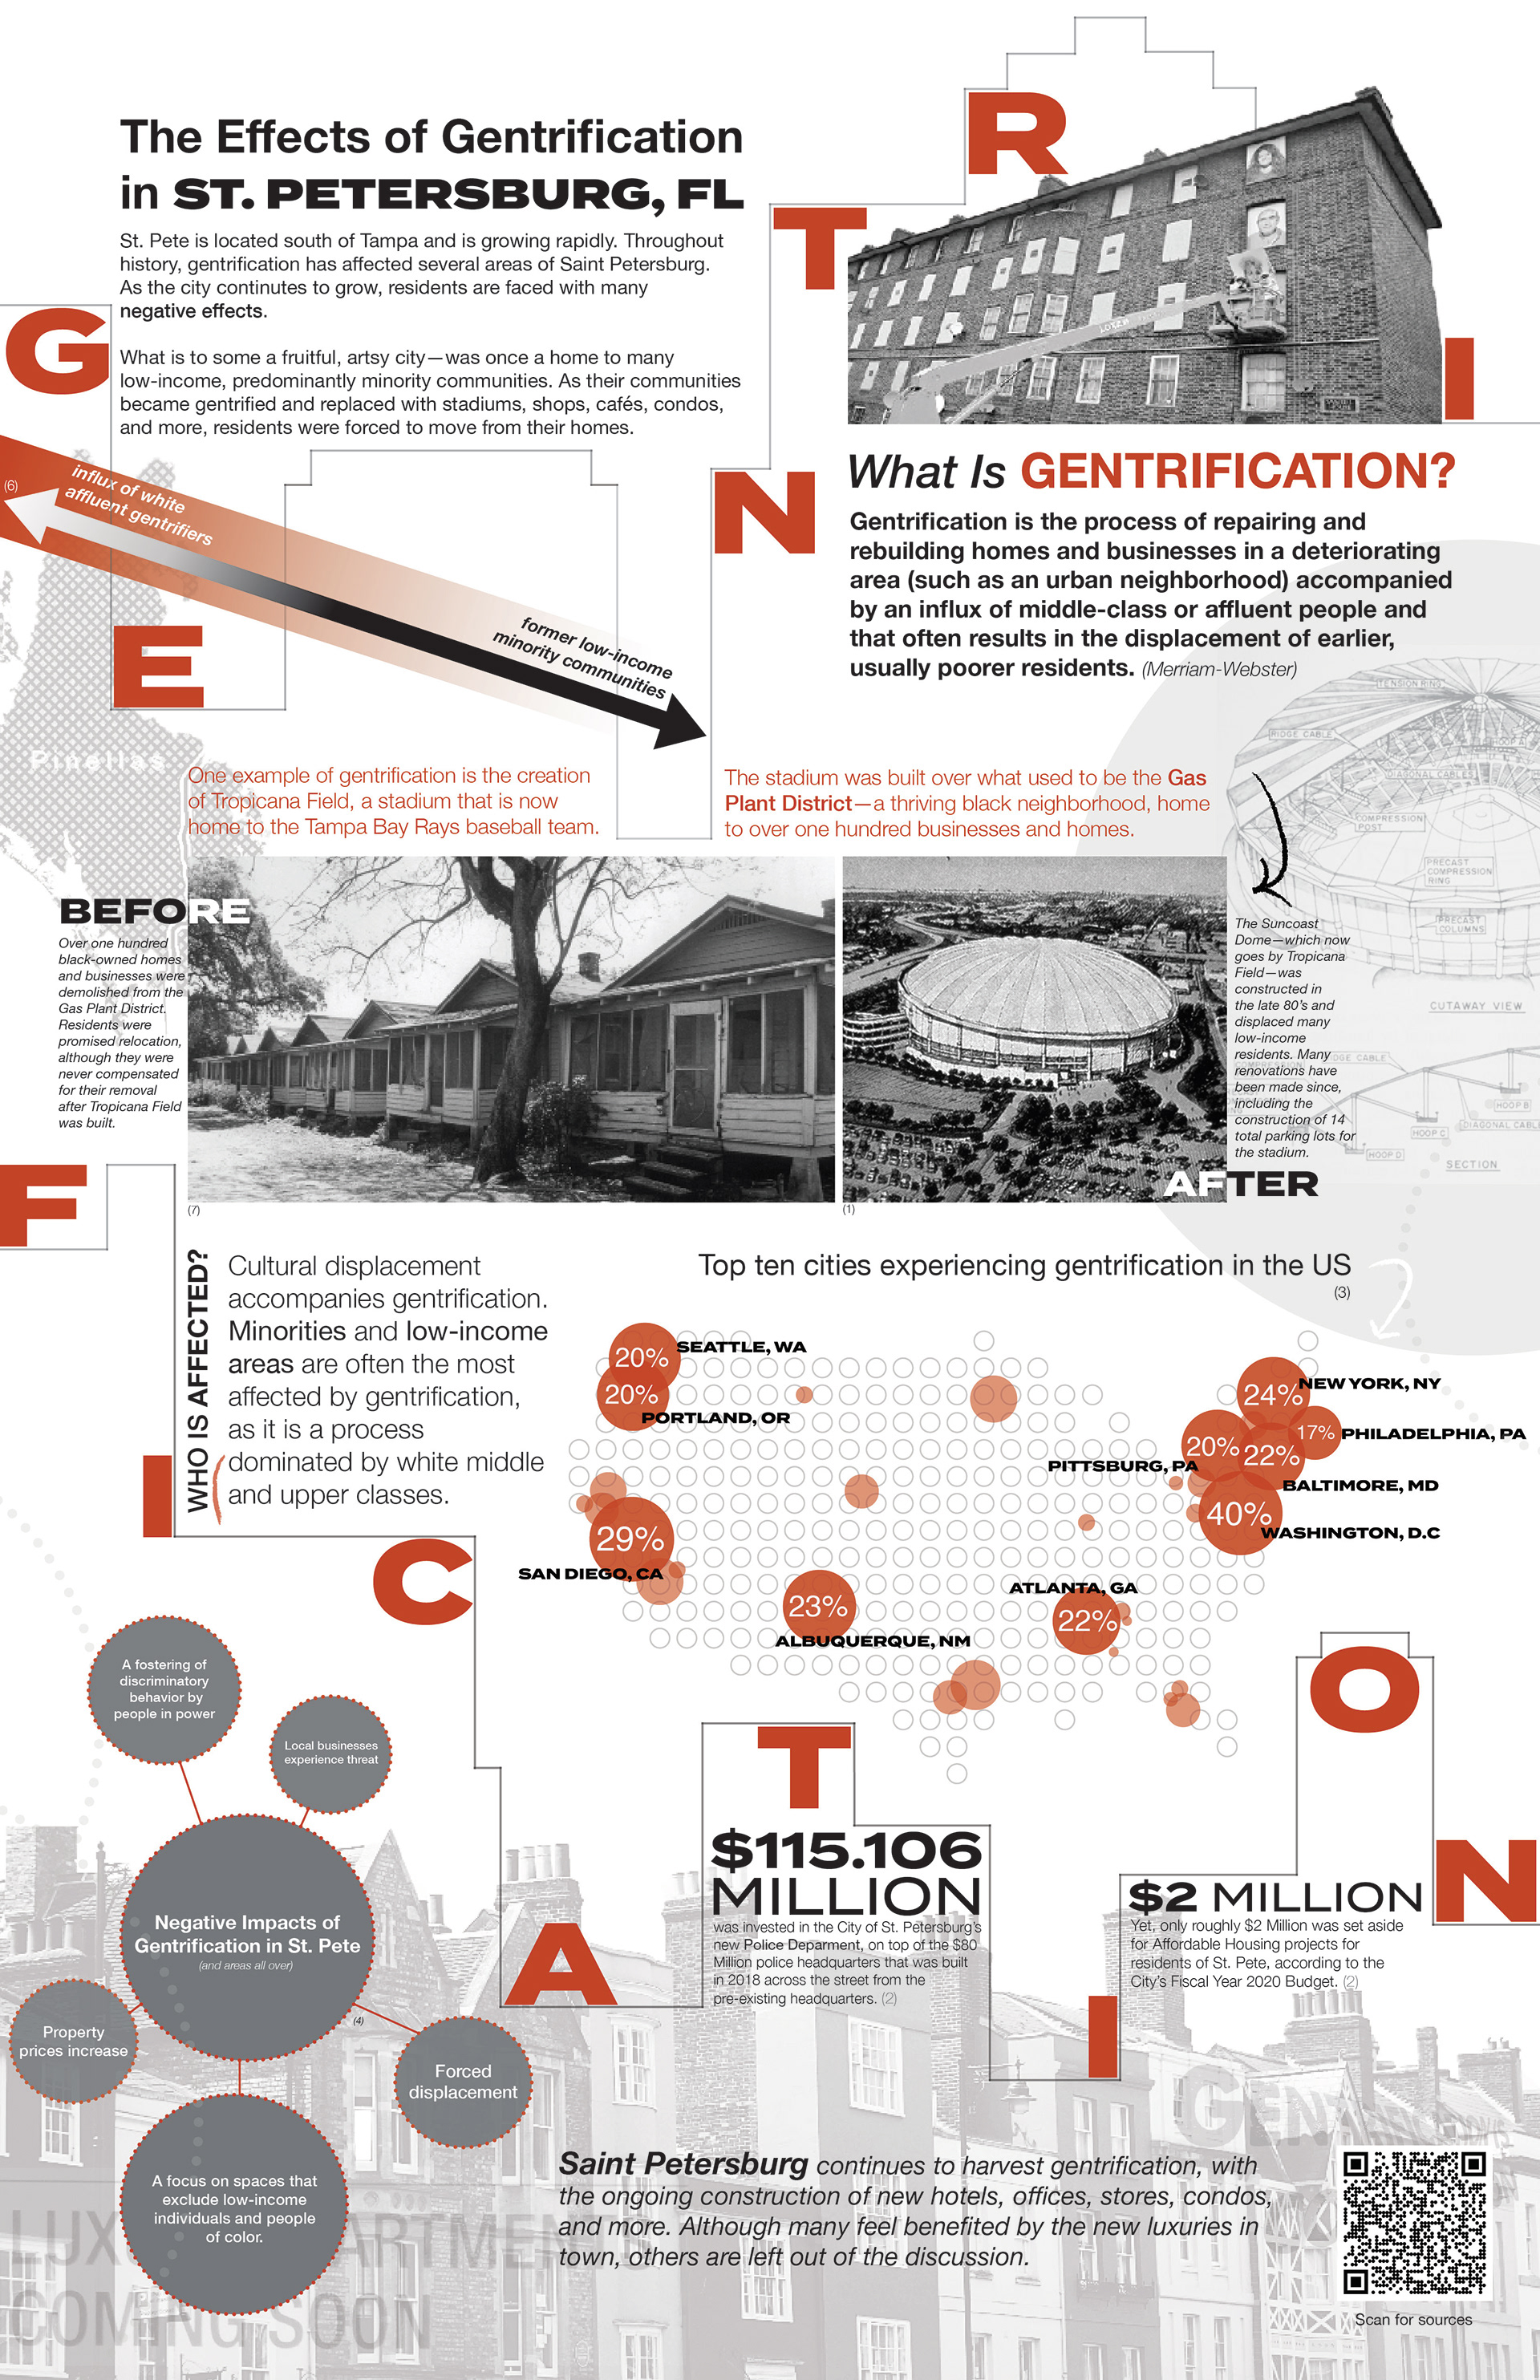
This piece is an infographic created to educate people on the effects of gentrification throughout history and how it continues today. More specifically, I focused on my hometown of St. Petersburg, Florida, and how it has transformed the infrastructure of the city over time.
I used typography and a visual pathway for the infographic to help the composition flow through many bits of information and smaller graphics. I used maps, photographs, and color to break up the space and communicate important information.
Final Infographic Poster Design
Process
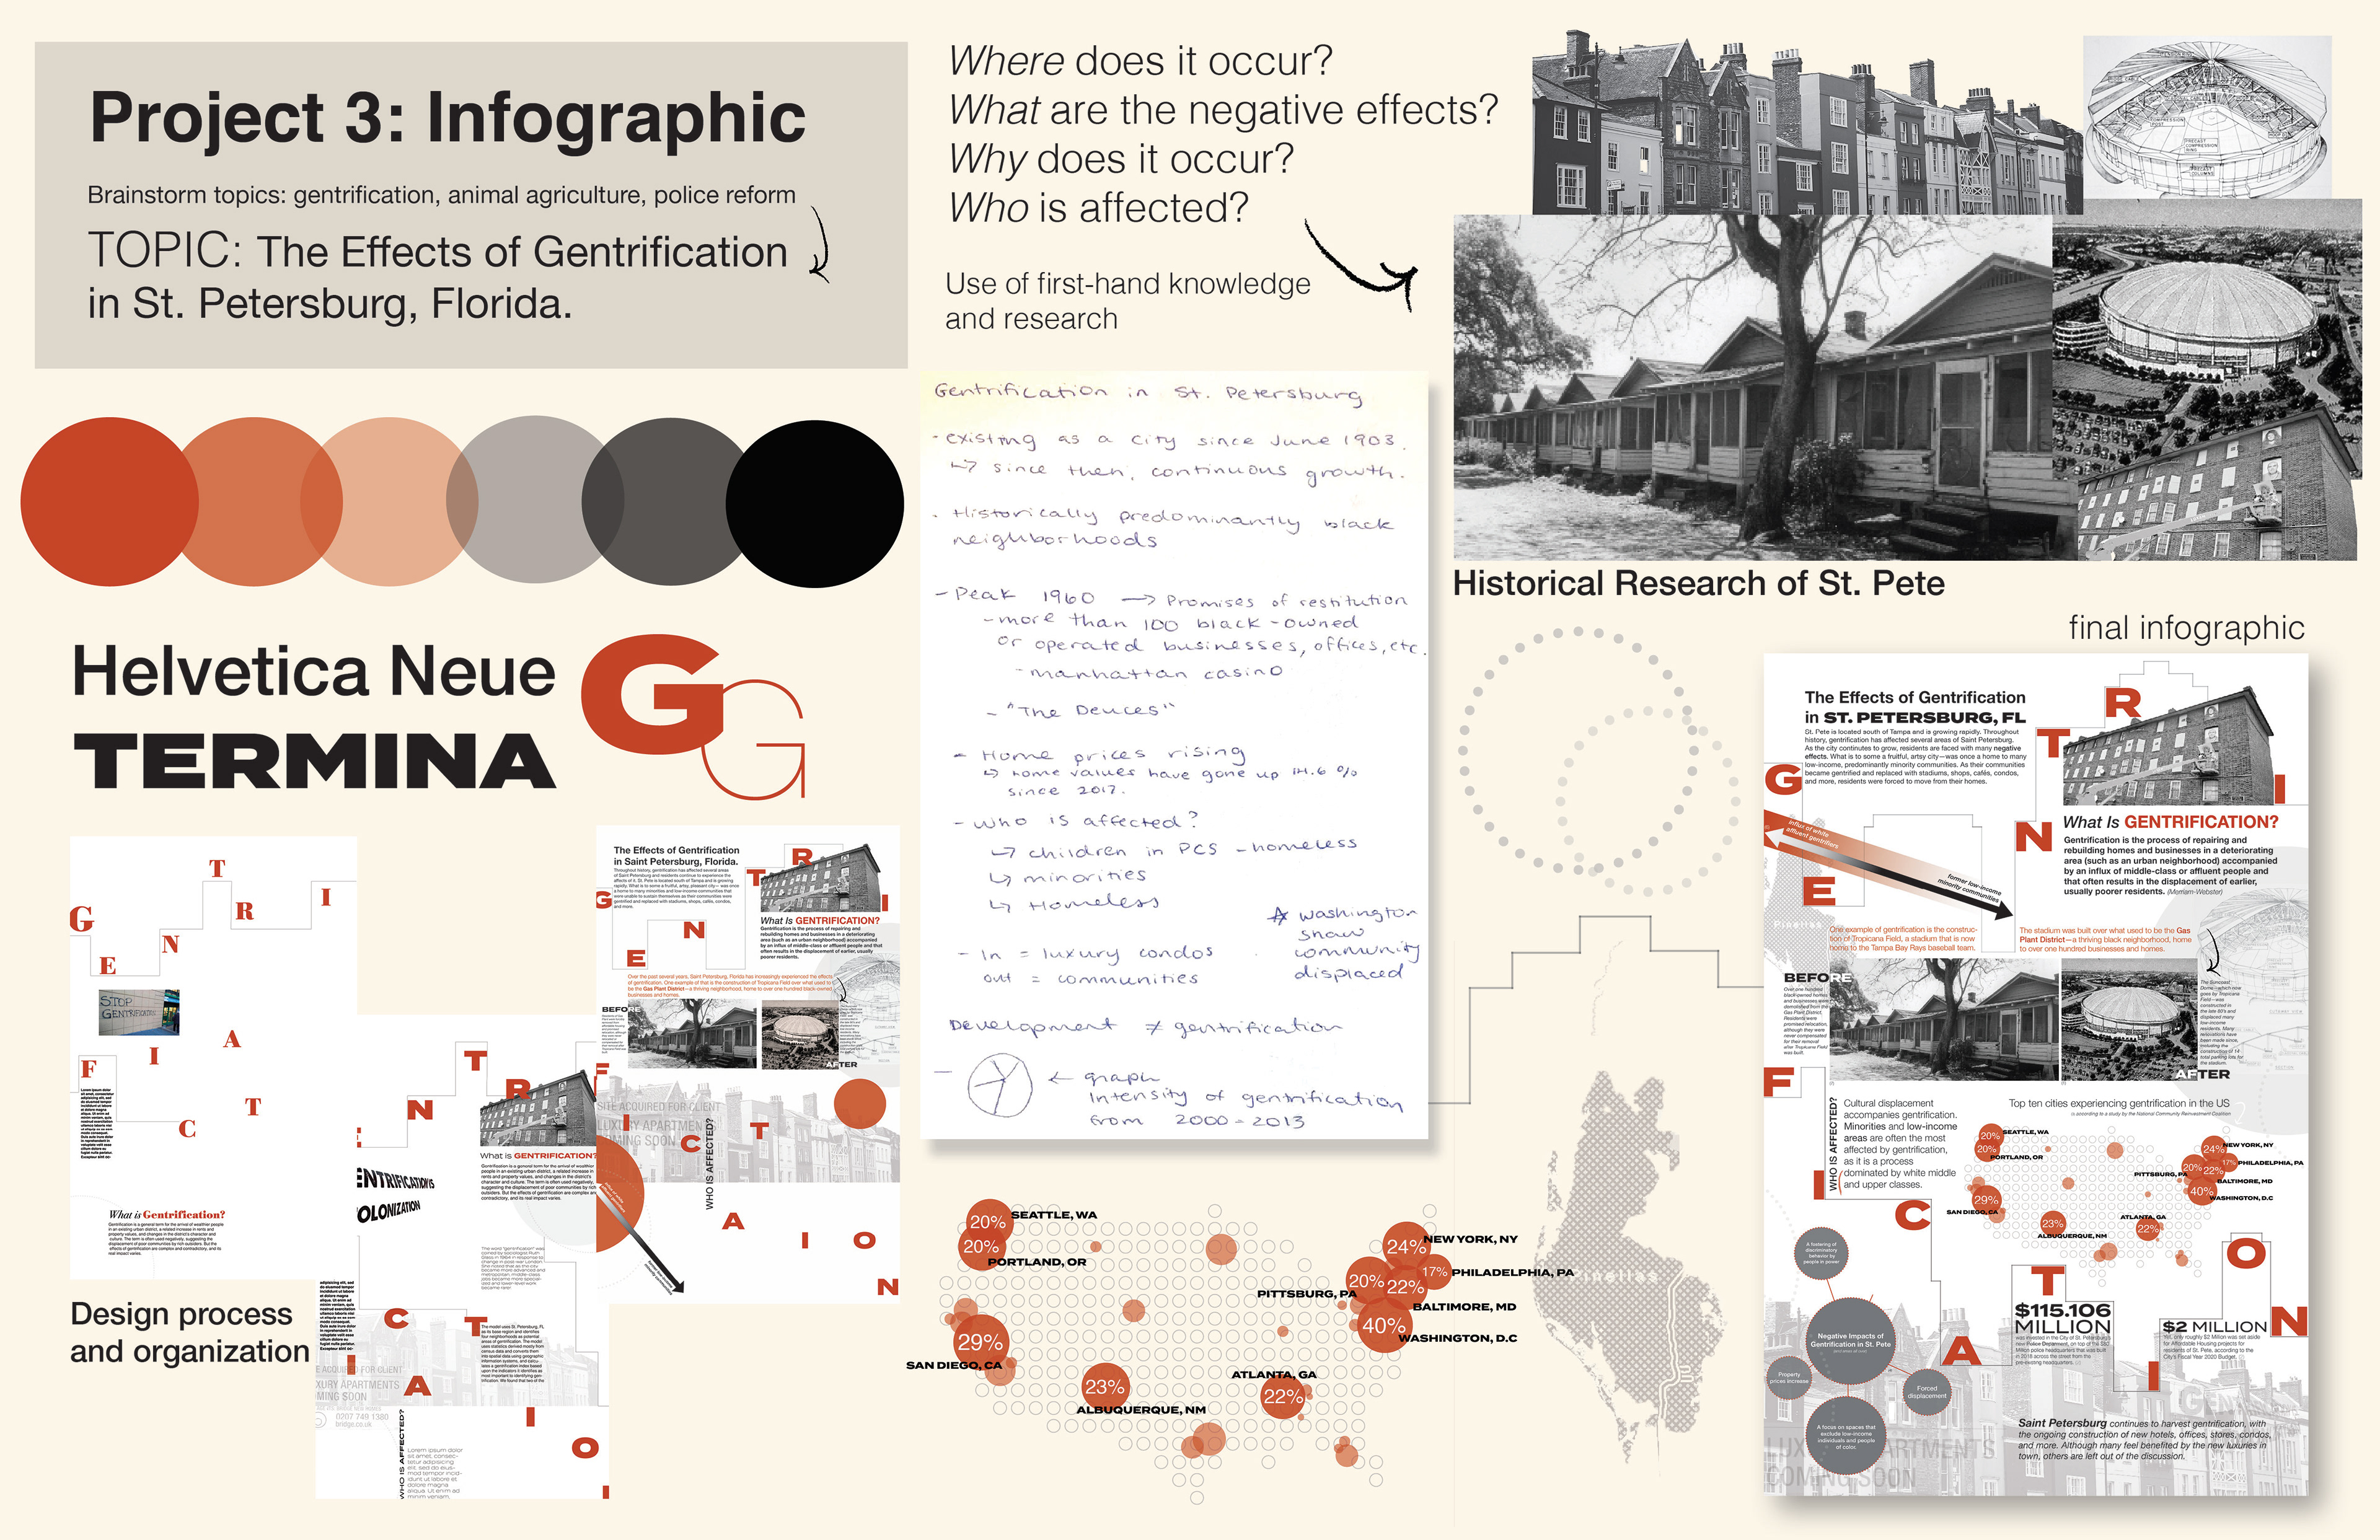
Map Design showing highest Gentrification percentages across the US.
